How to handle UX in startup
I recently had a very valuable consultation on the Projector Mentorship Platform. I don't think it's worth telling you who came to the conversation and why, but I would like to share the conclusions I made from this consultation.

I recently had a very valuable consultation on the Projector Mentorship Platform. I don't think it's worth telling you who came to the conversation and why, but I would like to share the conclusions I made from this consultation. I realised that a lot of UX/UI/Product designers have knowledge of the basic design process, but not always know how to combine activities to get the desired research result. And most importantly, they don't always understand what artefacts will appear in a particular research and how to use the results to improve their product after the research.And most importantly, they do not always understand what artifacts will appear in a particular study and how, after a discount, to use the results to improve their product.
In general, it's easy to work if you have someone more experienced on the project who tells you what to do, or even better, sits down — a roadmap of the project. But very often there are situations when you are the only designer on a project, or the picture of the world has not yet emerged and you don't know WHAT to do with the activity, or you worked on a large project and now you have been hired by a startup, where the rules of the game are completely different and you need to somehow handle the design quickly and accurately.

So let's figure out what to do if you're in a startup and want to do irreparable damage to the product.
We all know by now that there are many UX techniques to improve the user experience of a product. There are so many of them that it's easy to get confused. In my opinion, the best analogy here is going to a restaurant
For example, you walk into a restaurant and see a pile of incomprehensible utensils. There are different coffee and dessert spoons, ice and asparagus tongs, small and large pastry tongs, and various spatulas (pate, fish, ice cream or turkey) on the tables. It al looks impressive and confusing.

On the one hand, you can learn how to use all this, but it takes a long time, and often people never use a pate spatula in their entire life And so is a normal designer - they cannot know al the techniques and be able to do all the activities, because it is simply physically impossible to learn everything. And often, projects simply do not require certain niche or transit activities.
On the other hand, "The Road of the Spoon to Dinner" - it is desirable to know what and when to use it.
And on the third hand, there is a possibility that the designer has caught the Hot Hand phenomenon by surprise and is applying their usual design process to all projects. Without thinking and without understanding whether the project needs it, does it give me value?
NOTE:
The hot hand syndrome was first formulated by Ben Cohen in 2020in his book Hot Hand: The Mystery and Scientific Controversy of Streaks. The shortest way to describe the essence of this syndrome is the gambler's belief that he or she is omnipotent when they "hit the jackpot". As if the laws of physics have changed for him and he can do anything.
This kind of cognitive distortion exists not only in basketball, but can be present in any person when they are "caught up in the moment".
This is a very dangerous Bayesian principle, which can force a designer to run any project through the usual divergent-convergent process, use the same assets and hope that everything I do will always be SUPER.
So let's imagine that you are a designer who has worked for outsourcing for a long time and has come to the product industry. Which attributes will be the most valid and useful in this case? Of course, you can go all out and do all the activities in the world, from stakeholder mapping to daily research and benchmarking. But are all these activities equally useful?
Will your stakeholder want to pay for all of these activities? Here I would like to remind you that in any case, the beneficiary and the person who will pay for your work will be the stakeholder - your client. Therefore, it is desirable to be able to choose the right activities. Again, this is where the Method - Reason - Price Approach will come in handy.
Most likely, you will have to choose which ones you need to use in your work, which ones wil give you the most power and help your business to the maximum extent possible.
So let's go through the things you should do in your startup. Of course, this may be my subjective opinion, but if you have something to add, feel free to come to the comments and share your thoughts At the outset, let's agree on which product can be considered a start-up and which can be considered a mature giant.
- According to the launch of the product on Inintial Public Offering (IPO) If the product has not yet entered the IPO, then it is a startup, but if its shares have already been released and sold to everyone, then this is already a "burly man"
- According to the number of employees, everything is more blurred here: if you are a startup, you have few people working for you, if you are an established product, you have a lot of people working for you. But where is this "many" and.
- According to the time a product has been on the market If you have been on the market for a short time, you are a startup, if you have been on the market for many years, you are an adult product..
- According to the amount of investments attracted / profits received etc. These are also vague categories. It is not known how much investment or profit is needed to become an "adult product".
Personally, I don't care what you call your product - "startup" or "adult masthead giant". For myself (and I remind you that I am a designer and therefore look at classification exclusively from the point of view of a designer), I have defined a "startup" as any product in which a designer has to think about what to do, what features are needed here/now, and most importantly, you need to "sell" this feature to a stakeholder. So that they agree on the utilisation of your time for this particular proposed UX activity.
If we accept the difference between a startup and a product that I have proposed, then we can easily conclude that in a startup, a designer has more obligations, a higher level of responsibility and more influence on the final result. Of course, if the stakeholders/owners of the startup are decent people and are ready to listen to employees
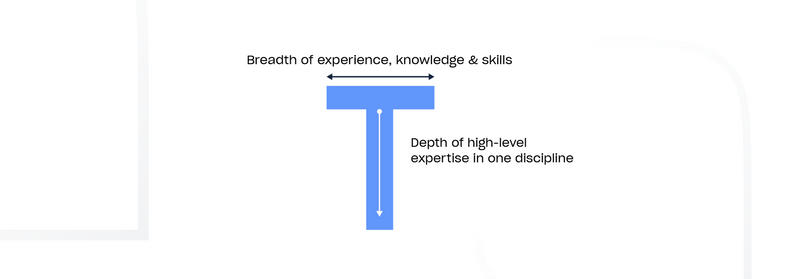
And of course, when you work in a startup, you are much closer to the stakeholders and their business. Therefore, you need to meet the needs of the business, understand them and think not only about the user (here we once again recall the statement that "a designer is a user's advocate"), but also about the business. That is, in a product/startup, a designer must cover all three spots of Norman's stool. And in order to cover the business aspects, it is advisable to understand what exactly the startup sel s, what it earns, where the margin is, what its income and expenses are, and sometimes shoot the "pink unicorns" of stakeholders when they start spouting unconfirmed product hypotheses. This is a great opportunity to develop into a T-Shaped or Paint-Drip specialist.
So let's get down to business. Which design activities (besides the standard ones like User Interview, User Persona, CJM, and others) wil bring the most benefit to a startup?
Business Model Canvas (hereinafter referred to as BMC)
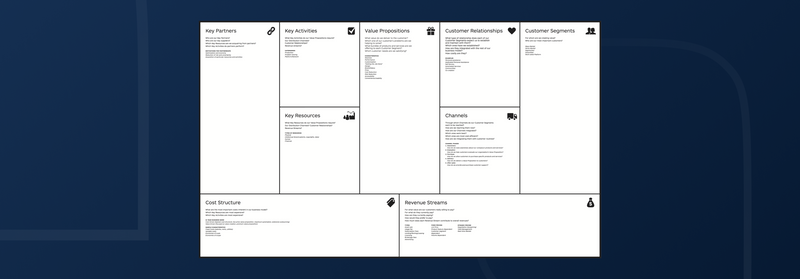
BMC is one of the tools for describing, visualising, evaluating, strategically managing and changing a business. It was developed by Alexandr Osterwalder (Strategyzer) in 2005 as a template for describing business. In fact, the BMC is a pivot table that contains basic information about the business, its main structures and business processes. This greatly saves time and simplifies the understanding of the business, because with a completed BMC, you do not need to go through a lot of different documents (business plan, strategy, various design artefacts, design briefs, etc.) to find the information you need.

The canvas is a table consisting of U blocks logical y divided into 4 groups:
1. Infrastructure - this describes how the company produces the product or service that the customer receives. This group consists of blocks:
- Key Activities — describes the most important activities that a company can do to implement its business model;
- Key Resources — describes the most important assets needed to make the business model work;
-
Partner Network – describes the network of suppliers and partners that help the business model to function;
2. Offer (Offering) — here you can find a description of the product itself, which is offered to customers. This group consists of one block: -
Value Proposition — describes a set of products and services that offer value to a specific customer segment
3. Customers — here you can find a description of the business in terms of its target audience and methods of interaction with it. The group consists of blocks: -
Customer Segments — defines different groups of people or organisations that the company seeks to attract and serve
-
Channels describes how the company interacts with customer segments to offer and deliver value proposition
-
Customer Relationships — describes the types of relationships that the company establishes with specific customer segments
4. Finance — a description of the financial side of the business. It consists of blocks: -
Cost Structure — describes all the costs required for the business model to work
-
Revenue Streams — includes the funds that the company generates from each customer segment (to get a profit, you need to subtract expenses from revenues) In the classic BMC, the sequence of filling out the template is often given, but in fact, the main thing to fill out the template is to obtain relevant and complete information about the business. How you fill it in is secondary. In addition, if you fill out the questionnaire during a kick-off meeting with стейĸхолдерами (called a ĸіĸ-off) or during a workshop with стейĸхолдерами, it is often difficult to keep the information in order, because your customer may not have a clear flow of information in their head. So, don't be afraid to deviate from the sequence, but be afraid of missing important information.
It is very important to understand what value BMC brings to your project (in our case, a startup). The main value is the aggregation of all the main information in a super-abbreviated form on one sheet. Even at this stage, you can solve 2 problems:
- communicate with your emails about what matters most in the company, reducing misunderstandings;
- see obvious problems in business planning/strategy/strategy.
If you additionally triangulate BMC with other studies, it will generally be chic. Most often, the Navy is a business analyst and designer. If you are a junior or middle designer, then it is advisable to be able to at least read the canvas and know how to work with it. You can read more about the Navy in the book by Yves Pinier, Alexander Osterwalder "Creating a Business Model". Of course, it is best to deal with canvases in practice, but if you do not have such experience yet, and you want to learn how to work with BMC, you can view examples of filled canvases for world-famous brands.
If you additionally triangulate BMC with other studies, it will be even more impressive. Most often, the Navy consists of business analysts and designers. If you're a junior or mid-level designer, you should at least be able to read the language and know how to work with it.
You can read more about the Navy in the book "Creating a Business Model" by Yves Pinier and Aleksander Osterwalder.
Of course, the best way to work with the pads is to practice, but if you don't have that experience yet and want to learn how to work with BMC, you can check out examples of fil ed pads from world-famous brands.
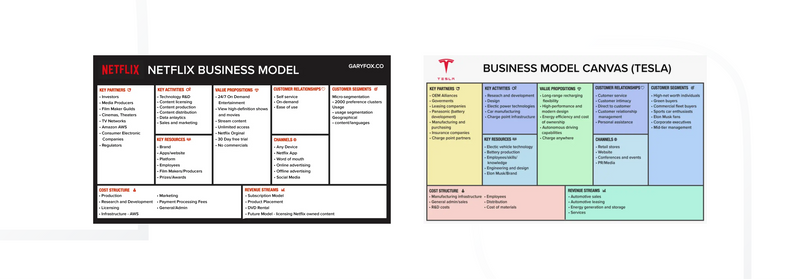
And everyone loves Business Model Canvas, but it has one big drawback - it describes real businesses (coffee shop, grocery store, etc.), but for digital products, it is no longer super-useful and has certain drawbacks. To adapt the BMC for digital products (especial y at the startup stage), another canvas, the Lean Canvas, was developed.
Lean Canvas (LC)
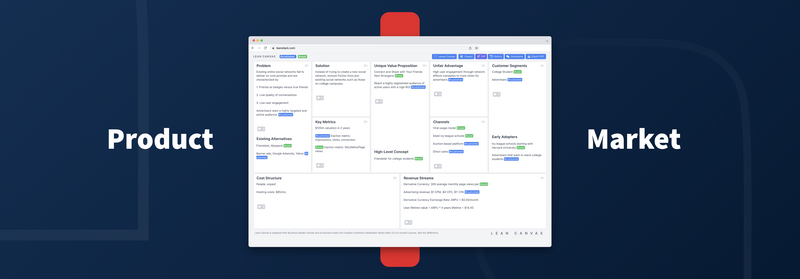
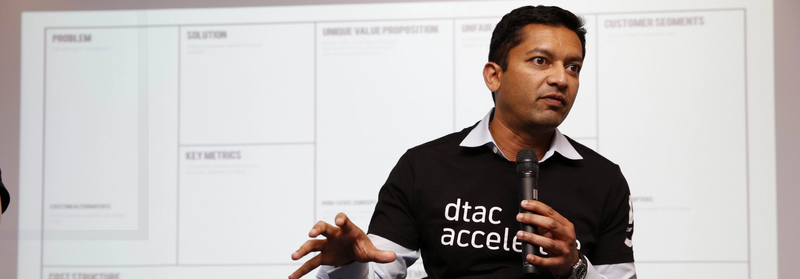
LC is a one-page business description template developed in 2010 by Ash Moriah, which is an adaptation and optimisation of Osterwalder's Business Model Canvas, but for startups and more of digital products.
The main advantages of LC are:
- Speed – unlike writing a business strategy or a business plan, which can take weeks or months, LC can be completed in one day. This is especially fast with the help of a workshop with stakeholders.
- Ease of use (Portability) - it is obvious that a one-page artefact is easier to share with your col eagues and thus to gain an understanding of important aspects of the business.
- Conciseness — LC allows you to quickly highlight the important things and explain everything to the stakeholder in one session. Everything is thesis-based and maximally clear.
- Efficiency — the canvas allows you to quickly and easily present and monitor progress. Like the Business Model Canvas, the Lean Canvas is a graphical canvas that allows you to quickly map out your business and quickly understand al the advantages and disadvantages. The LC consists of U blocks, some of which have additional blocks - so the total number of all blocks is 12 blocks and describes EVERYTHING about the business!
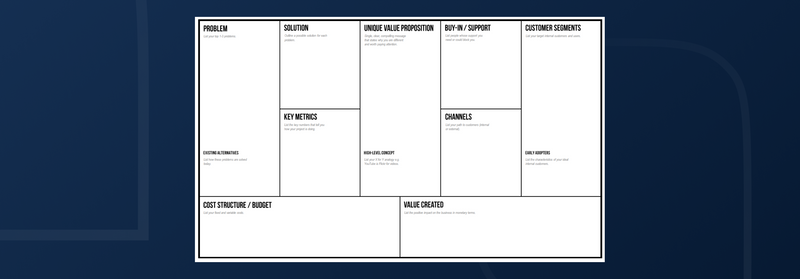
Lean Canvas Blocks:
- Problem — The Target Audience you are planning to work with will have a certain set of problems that they want to solve. Therefore, in the corresponding block, you need to specify from 1 to several problems of the target audience that you want to solve with the help of your product. It's hard to imagine that a product can be successful and needed if it hasn't found the needs and problems of its target audience, so this is a very important block!
- Existing Alternatives - This is where you describe what alternatives are available on the market that your target audience can use to solve their problems. This is where the Direct and Indirect Competitor Analysis will come in handy.
-
Solution — This block best explains the essence of Lean Startup - here you should write down the solution to your target audience's problem. It's okay if this solution doesn't lie on the surface, but you need to come to it. It is very timely to recall the statement of Steve Blank (the godfather of the Lean approach) "What you need to do is Get Out The Building". To understand the solution, you need to get out of the office, because working in your office will be categorically wrong in this case - you need to go to people and ask questions.
- Key Metrics — this is where you describe what metrics you wil measure to track the dynamics of your product development. We'll come back to metrics later in this article.
- Unique Value Proposition — (UVP) is probably the most important LC block, because it demonstrates the promise of your product to solve the user's pain. This is the main reason why the target audience wil buy from you instead of your competitors. Of course, this block must be filled in!
-
High-Level Concept —In this block, you put a certain phrase/sentence/statement that can succinctly describe your CA. It can even become the slogan of your product. The main thing here is to say what your product is about in a short and clear way. There are examples of such high-level concepts from well-known products: "The Smartest Way to Get Around" - UBER "The Experience IS the Product" - Apple iPhone "Be More Productive at Work with Less Effort" - Slack
- Unfair Advantage — In this section, you record those advantages of the customer's company that are difficult or impossible to take away or copy. This can include a variety of advantages: Technical (e.g., your product is written on some proprietary technology), human (e.g., you have a strong team of designers, analysts, and managers who are skilled at working with product hypotheses), business (you have partnership agreements with suppliers, an official representative office, the ability to dump the market with high margins) and other (for example, your product is a monopoly on the market, has been operating for a long time, or has a large base of contractors).
-
Channels — This block displays information on how you will interact with your target audience? What communication channels will you use?
The Lean approach involves a fast, continuous cycle of Create/Measure/Learn, so to get constant and fast feedback from your target audience, you need to understand what analytics you use to talk to people.
- Customer segments — In this block, it is important to describe your target audience and the problems you will solve. Without understanding your user, it will be difficult to make a successful business, so even if you are using Jobs To Be Done, you need to understand who your user is! It's also important to understand that even if your stakeholder knows best who needs their product, it's still important to validate their hypothesis, because a proto-anova won't do you much good.
- Early Adopters — This is where you describe the category of users who will be the first to use your product and will, in fact, become your evangelists and adopters. Of course, they will like you But if everything comes together, you will have real fans - they will follow you everywhere.
- Cost structure - This is where BMC comes in - you describe the costs of running your business.
-
Revenue streams — Similar to BMC describe the main sources of income.
It is also worth noting that if you fil in the questionnaires at the i -ofu stage, you wil most likely get a proto-anvil. That is, this artefact wil not correspond to reality 100%, because it wil be the vision of stakeholders.
And if no activity or research has been carried out beforehand, it is only the vision of your client, and it may be very far from the truth.
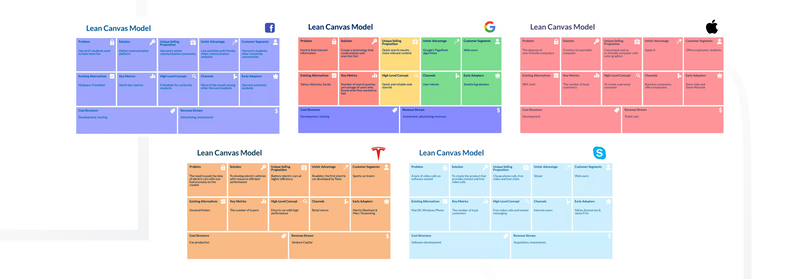
And again, here's a selection of products from a shelf full of well-known brands.
Value Proposition Canvas (VPC)
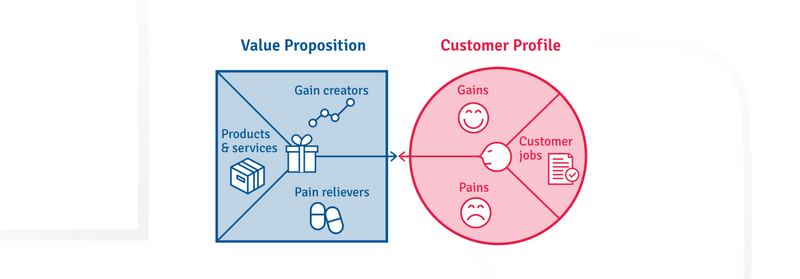
VPC is another of Oleksander Osterwaldeer's cannas. It was first developed in 2008 as an add-on to BMC, with the help of which you can control how well your product fulfils the requirements of your target audience.
The advantages of VPC are:
-
Accurately define product user profiles - VPC easily identifies the pains, challenges and difficulties users face when trying to solve their problems and the benefits they receive.
-
Visualisation of the value created by the product - the user journey describes the most important components of the user experience: the challenges, pains and benefits of the customer.
- Achieving product compliance with the market - the artefact allows you to easily refine the offer продуĸту based on the information received from customers and achieve matching продуĸту to the market. VPC consists of two parts: A customer profile and a value map. So let's look at each of these parts in turn.

A customer profile is a structured and detailed representation of a specific user segment. It is divided into 3 segments:
- Client objectives - reflects what clients are trying to achieve in their work and life.
-
Pain - poor outcomes, risks and obstacles associated with clients' work.
- Benefit – describes the results that customers want to achieve or the tangible benefits they expect.
In turn, a value map (or value proposition map) describes the features of a particular value proposition in a structured and detailed manner. It divides the value proposition into 3 segments:
- The list of goods and services obviously reflects all the goods and services that form a value proposition.
- Creating benefits - describes what your target audience gets from your product's goods and services.
- Painkillers - your products and services "soothe the pain" of clients - solve certain problems.
As with the Business Model Canvas and Lean Canvas, the Value Proposition Canvas can be completed with stakeholders in a workshop format, but again, this wil be a proto-anvil. For Value Proposition Canvas to become a real artefact that wil cover al the necessary and important aspects of your product, you need to conduct a series of user interviews to validate the user segment and provide a complete understanding of what services, benefits and payoffs your product offers to fully meet the needs of the target audience. This is where the Empathy Map can come in handy.
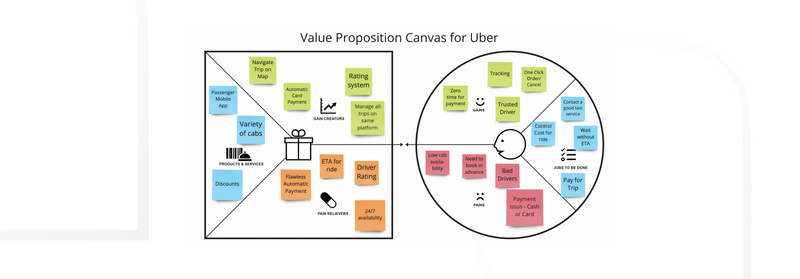
Here you can see the completed canvases for well-known brands.
Unit Economics (UE)
UE is a specific method of accounting, analysis and planning of financial of digital products. Unfortunately, I could not find when UE was developed, but from my own experience I can say that it already existed in 201S and was used to the fullest.
The Economy unit exists to "hit" the designer and the entire team with reality, to shift the focus from the feelings of users to the numbers that stakeholders love and understand.
But what kind of beast is this Unit Economics? UE is a certain method of calculating the income and expenses of an individual business model (business) in relation to a certain unit. Of course, for every business, A "unit" will be a certain basic element that c a n b e q u a n t i f i e d and depends on the business model itself, its monetisation and many other factors. For example, for an airline company, this unit will be the sold airline ticket, for a taxi service - the freight (transportation) sold to the customer, and so on. In fact, everything is very simple. If you know a little bit about financial theory, you probably know what a balance sheet is.
Accounting balance sheet (balance sheet, balance sheet) is a statement of the financial position of an enterprise as of a certain date, which shows in monetary terms its economic means (assets) and sources of their formation (liabilities and equity).
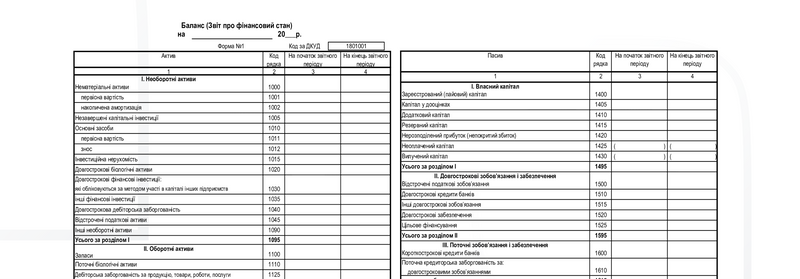
The main advantages of using UE are:
-
UE can help you forecast your business income. Since UE is tied to Unit, it can be used to predict the profitability of your business quite easily (or when it will be expected return to profitability).
-
UE can help you optimise your product. As well as helping you determine product reliability, UE can help you determine which product optimisation strategies are favourable, determine the appropriateness of marketing spend, and more.
- UE helps to determine whether your product is sustainable in the marketplace. In the early stages of your startup, UE can help determine the future potential of a product and, as a result, its potential market sustainability.
So, Unit Economics is the same concept of Balance, but in the context of digital products. It operates with such metrics (concepts) as:
-
Lifetime Value (LTV) is the average amount of money you earn from a single customer over the course of their relationship with you. In SaaS, it's the amount of money you make from the moment a customer signs up to the moment they cancel their subscription and n e v e r c o m e back. Calculating LTV can tell you a lot about your business, so it's one of the most important metrics.
-
Customer Acquisition Cost (CAC) is the total amount of money a company spends on sales and marketing to acquire one customer.
-
If you spend too little, you don't get new customers. If you spend too much, you reduce your margins and, as a result, you get less profit. A reasonable amount of spending is directly related to your LTV, so calculating and understanding your CAC is extremely important.
-
Churn Rate or Churn Rate (CR) is the percentage of your customers who cancel their subscription within a certain period of time. As яĸ your startup strives to grow, it is important to keep track of the dynamics, so Поĸазниĸ Otto's CR can be an important metric to look at changes in яĸ in the ĸоротĸостроĸовій and in the long term.
-
Retention Rate or Retention Rate (R). The Retention Rate is the opposite of the Churn Rate. It is the percentage of customers who return to the product and remain subscribed for a certain period of time.
-
Average Customer Lifetime (ACL) is the average period of time a customer remains a user of a product or service.
-
Obviously, ACL is a key component in the LTV calculation. Number of Customers (C) is the total number of customers of a product over a certain period of time.
-
Number of Transactions (T) Not every customer is billed at the same frequency, so this measure covers actual transactions made during a certain period.

-
Total Revenue (TR) is the total amount of money your product has earned in a certain period.
-
Gross Profit (GP) is the total revenue of a product minus the cost of sales.
-
Average Order Value (AOV) is the total revenue divided by the number of orders (transactions).
-
Average Gross Margin (AGM) is the gross profit of a product divided by its total revenue.
There are 2 methods of calculating Unit Economics:

-
The definition of a Unit is "a unit of a product or service sold" In this case, you calculate the Margin by subtracting the cost of sales from the cost of the Unit. UE = Price per Unit - Costs per Sale 2. The definition of a Unit is "One Customer", i.e. in this case, you do not link the calculations to sales, but to the customer himself.
-
In this case, the Unit of the Economy is calculated as the ratio of the Customer Lifetime Value (LTV) to the Customer Acquisition Cost (CAC) UE = LTV/CAC
In this case, you need to calculate the LTV. There are two methods for calculating it: predictive and flexible.

Predictive LTV helps you to predict the actions (and therefore revenue) of a customer in the future. It is calculated in the following way: Predictive LTV = (T x AOV x AGM x ALT) / number of customers by a certain specified period Here:
-
T (average number of transactions): The total number of transactions divided by the specified interval. This way you get the number of transactions for the time period you need.
-
AOV (average order value): It is determined by dividing the total profit by the number of orders (goods or services sold) - thus we get the AVERAGE value of the order.
-
AGM (average gross margin): To calculate this, we subtract the cost of sales (CS) from the total revenue (TR). The equation is as fol ows: AGM = ((TR-CS) / TR) x 100.
ALT (average life expectancy of a customer). ALT is equal to the Churn Rate (CR) divided by 1. ALT = CR/1 In turn, the Churn Rate is determined by comparing the number of customers at the beginning of the reporting period (CB - Customers at the Beginning of a given period) to the number of customers at the end (CE - Customers at the End). Churn rate = ((CB-CE)/CB) x 100.
Obviously, the marginal LTV is aimed at predicting and forecasting financial metrics, but in the case of startups, it is necessary to have a more flexible LTV metric that wil quickly respond to changes in the market and product positioning. That is why there is a so-called "flexible LTV".
Flexible LTV = GML x (R/(1 + D - R))
Here
-
GML (average gross margin per customer lifespan) is the amount of profit your business makes from one customer over the period of time they use your product. It is measured: GML = GM x (TR / C) Here: GM - Gross margin TR - Total revenue C - Number of customers in a given period
-
D (Discount rate): The discount rate measures the rate of return on investment (ROI). This is valid if your startup has attracted investment.
- R (Retention rate): The retention rate will be described in more detail in the following activity, but for this formula it is calculated as R = ((CE - CN) / CB) x 100 Here: CB
- Number of active ĸористувачівs that have made multiple purchases at the BEGINNING of the reporting period CE - Number of active ĸористувачівs at the END of the period CN - Number of active ĸористувачівs involved.
Another very important metric of Unit Economics is the cost of acquiring users - CAC. It shows us how much of our marketing spend is reasonable and how much of our investment in advertising and other sources are doing a good job of generating new leads for your product.

CAC is super easy to calculate:
CAC = SMC / CN
Here:
- SMC - Sales and Marketing Costs — Sales, advertising and marketing costs.
- CN - Number of Acquired Customers (New Customers) - Number of users involved.
It is logical that all these measurements and miscalculations take time to track over time. And it is obvious that for startups, the frequency of miscalculations and measurements should be small enough to respond quickly to any changes in the market.
And it is logical that you are now asking yourself the question:
"Bearded, all this is cool and interesting, but is it all counting with your fingers on a piece of paper? It's hard!". Of course, no fingers and no mechanical miscalculations.
Microsoft Excel will help you - you just need to set up the document once and it wil do everything for you. You can also create graphs and track dynamics there.
And the figures for the calculations will be provided by the finance department and Google Analytics, so don't be afraid, just start counting.
AARRR: Pirate Metrics Framework (PMF / AARRR)
The AARRR framework or Pirate Metrics is a framework for working with behavioural product metrics. It was developed by Dave McClure, an American entrepreneur and private equity investor. AARRR is an acronym that reflects the essence of this framework.
Pirate metrics (by the way, they are called so because in films and comics pirates speak in a similar way, so the word "pirate" here does not have a negative context) consist of 5 interaction stakes and can be displayed in the following way:
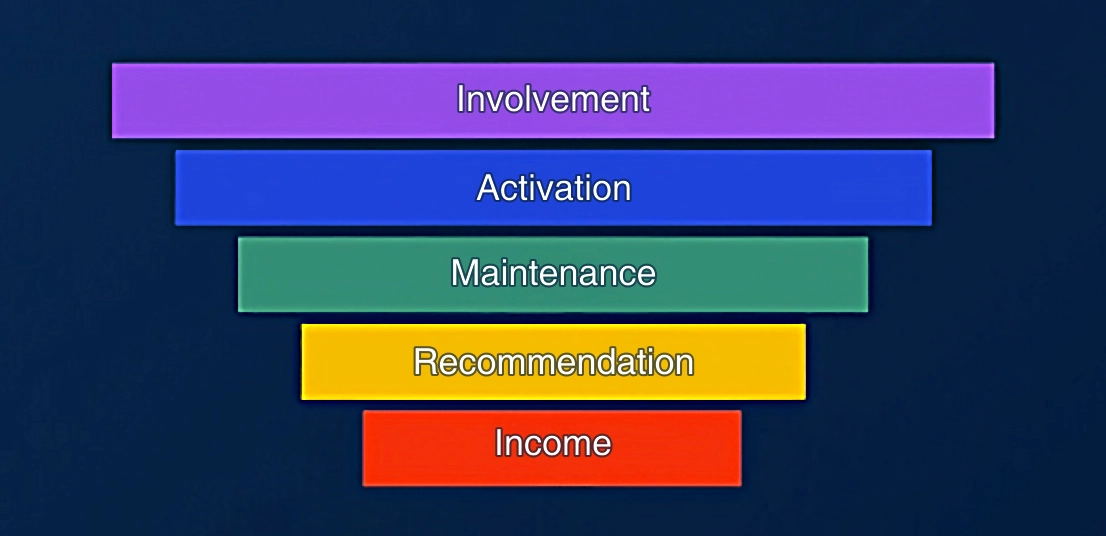
- Acquisition (A) - this stage of interaction is responsible for attracting new visitors to your product. Here you can work out the methods by which people wil learn about your service. You may have heard of the "7 Touches" theory. It's widely used in sales, politics, and politics alike, and states that a potential customer needs to hear about you at least 7 times to remember and be interested. Of course, the number 7 is not a constant, but it shows that attracting new customers is not as easy as it seems. And that's exactly what you're doing in the Vision stage.
- Activation (A) - in this stage, you work on user activation. The main goal of this stage is to turn an ordinary visitor into an active user.
- User retention or Retention (R) - obviously, after a certain time, users may forget about your product or service. This is where retargeting comes in handy to bring users out of dormancy and into active use. After all, as designers, we are interested not only in a great user experience, but also in ensuring that we generate constant revenue. So let's keep the users coming back and motivate them to keep using it.
- Referrals or Referral (R) - this stage of interaction reflects how much your users are wil ing to recommend you to their friends and acquaintances. It's great when your desktop users are happy enough to become adherents of your service and recommend you on all the forums, social networks, etc. If this is the case, then help them to do so and they will bring you new users through referral programmes, referral codes, etc.
-
Revenue or Revenue (R) - obviously, this item answers the question "how much users are wil ing to pay you", how much money they bring in, etc. The previously mentioned Unit Economy will be useful for working on this stage.

For each of the interaction stages that I have already told you about (Acquisition / Activation / Return / Referrals / Revenue), you should work out 2 important points:
- Methods by which you will influence a specific stage.
- Metrics that you will use to measure the dynamics of change.

Of course, here the work of a designer goes way beyond the usual deli art. You wil have to work with analytics, track metrics and react quickly to changing metrics.
NOTE: It is important to understand that the AARRR framework is good and can be useful for your startup. But in isolation from the metric, it does not work wel , because it requires metric control.
Service Blueprint (SB)
Almost all designers know how to work with the user experience using the Customer Journey Map (CJM), which was invented i n 1U85 by Chip Bell and Ron Zeme. Then CJM moved from marketing to design, and now it is one of the most popular design activities, and the CJM is probably the most popular and useful artefact of a UX designer's work.
Obviously, CJM is a mandatory activity, with the help of which a UX designer identifies problems of interaction between the user and the product. But in a startup, it is important to see the whole picture globally.
That is, not only the actions of the user, but also the actions of the product, because important events can take place under the umbrella of the service, which will affect the user's experience. And very often, it is the product side that may have a problem. This is where Service Blueprint comes in handy.

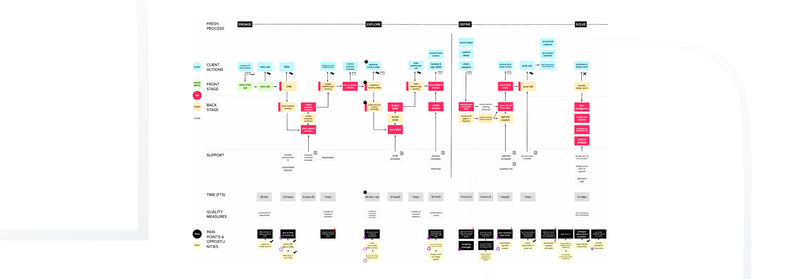
SB is a technique used in service design. This technique was invented and first described in the Harvard Business Review back in 1U84 by banker and investor Lin Shosta. And today, this tool, which is an add-on to the aforementioned CJM, is already used by UX designers around the world.
Let's find out what Blue Print is all about together.
The main advantages of using SB are:
- It allows you to quickly find product shortcomings, as it takes into account many aspects: interface flaws (bad design, broken button, incomprehensible hint, etc.), system problems (corrupted data, long response time, etc.).
- It allows you to find possible ways to optimize. For example, you can optimize your customer's onboarding (part at signup and part at first using the product). Then users will be pleasantly surprised by the care of the product, when it remembers the user and fills in part of the data in advance, you will save time on re-collecting information about the user.
- It allows you to find possible ways to optimize. For example, you can optimize your customer's onboarding (partly during registration and partly during the first use of the product). Then users will be pleasantly surprised by the product's care when it remembers the user and fills in some of the data in advance, and you will save time on re-collecting information about the user.
- It combines different points of user interaction with the product and takes into account different departments of the product. For example, if your product is quite complex and has several points of interaction (website, app, real-world interaction points), the team of employees is divided into a complex hierarchical structure (for example, there is a separate user acquisition department, a return department, a main interaction department, and many others), then SB will be able to link all interactions into one mapping method.
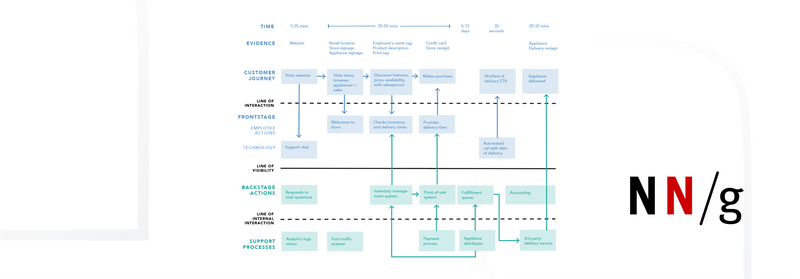
As I mentioned above, SB is an add-on over CJM. So it has a few key elements:
- User Actions This describes the actions a user must take to complete the main flow in your product. Of course, the main flows can be considered those related to monetization and user engagement. In the classic Service Blueprint, user actions are understood as flows - that is, steps from your CJM, although in my personal opinion, it is optimal to use the entire CJM at this step, as it will give you complete information (that is, drag in your SB more actions, thoughts, words of the user and opportunities for improvement at each phase). To help you understand what I mean a little better, I'll remind you of the Official CJM Template from NNGroup.
- Frontstage Actions Sorry for the anglicism, but Frontstage Actions refers to product actions that the user can see directly. If we're talking about a digital product, this can include human-human or human-computer interactions. Human-to-human actions include user interactions with the product's contact person (for example, in a restaurant, you interact with a waiter who is a representative of the business). And human-computer actions are obviously interactions with technology (for example, an application on a mobile phone, an ATM, an ibox, etc.) For example, when ordering pizza or sushi, you (as a customer) interact with the website or app (where you place your order) and the courier. This is the Front Stage - you see the courier bringing you sushi and perceive him as a representative of the service.
- Backstage actions At the Backstage stage, the processes of the service that are hidden from the user are already taking place. That is, what the user cannot see. It's like backstage. In the sushi example, this is processing your order, preparing your set, packing it, etc. You, as a user, guess that someone is doing this work, but you don't know for sure. But if you are a designer in such a product, it is advisable to describe these processes, as they are available to you. And another personal life hack tip from me: if your project provides a product or service, after you have compiled a Service Blueprint with the words of all the services involved, try to use your service as a user. This way, you will see the shortcomings personally, because your metrics may have lied a little bit to idealize certain processes, and this can affect the user experience, and as a result, the business.
- Processes These are certain additional services and interactions that take place to keep Backstage and Frontstage running. These services can be both in-house (internal) and external services. For example, a marketing department may be necessary for the normal operation of a product - it is not directly involved in the provision of the service, but without this particular department, the product cannot work. This is an example of an internal support service. You may also need a collection service - this service will be provided by your counterparty bank, and this is an example of an external support service.
- Evidence This is some evidence of a user's interaction with a company or service, points of interaction, etc. This includes interaction artifacts (payment receipt, receipt, product application, etc.) and interaction points (website, email, mobile application, etc.).
- Time For each stage of your Service Blueprint, it is advisable to record the time of user interaction with the product. Of course, if you are just developing a product, this time will be very approximate and calculated theoretically, but if the service is already launched, it is advisable to record the real time by making periodic control test purchases.
- Metrics At each stage of user interaction, you can measure certain metrics that will demonstrate the success of a particular stage. This is where AARRR comes in handy again.
After mapping the product with Service Blueprint, you as a designer will get the most complete information about the user's interaction with your product, and therefore I advise you to periodically update the artifacts you have created after several completed sprints. Of course, a release doesn't always radically change the UX of your product, but when it does, try to capture these changes in an updated artifact so that you can compare the dynamics of changes later. That's why it's a good idea to create a space in your Jira where you'll keep all the design artifacts you'll be working with.

Of course, there are several more activities (such as BPMN-mapping, analysis of trigger mechanics, calculation of product and UX metrics, and many others) that are worth paying attention to, but for today, I think we should stop.
So, your question will be logical: "What if I work on a regular outsource project, do I need to know and do these activities?". And my answer is simple - "YES". After all, no one will forbid you to add value to the project. In general, the product approach is also possible on regular outsourcing projects.
What's Your Reaction?


![[VIP] DesignCode: Build Beautiful Apps with GPT-4 and Midjourney](https://design.rip/uploads/cover/blog/designcode-gpt4.webp)
![[VIP] AppCoda: Mastering SwiftUI - Professional Packet (Updated 04.2023)](https://design.rip/uploads/cover/blog/appcoda-mastering-swiftui-professional-packet-worth.webp)
![[VIP] AppCoda: Beginning iOS Programming with Swift (Updated 04.2023)](https://design.rip/uploads/cover/blog/appcoda-beginning-ios-programming-with-swift.webp)
![[VIP] Whoooa! 156 vector Lottie animations](https://design.rip/uploads/cover/blog/whoooa-156-vector-animations.webp)


